PeopleForBikes 2026 Bike Rating Changes Make Connectivity Challenges Apparent
PeopleForBikes has just released their 2026 City Ratings. This yearly analysis of local bike networks shifts in how we look at connectivity around the Pikes Peak region.
Looking into the raw scores for Colorado Springs and Manitou Springs, the results might surprise you. But before drawing conclusions about our progress, you’ve got to look under the hood. For 2026, PeopleForBikes completely rewrote their math. They raised the bar for what counts as a safe, “low-stress” place to ride, which resulted in much of our existing on-street lanes being reclassified as high-stress.
While we initially worried this tougher stance would hide the hard work our community and city teams have put in, the final numbers tell an honest story. They give us a realistic map of how safe our streets actually feel to an average neighbor on a bike, while highlighting the unique political boundaries we have to navigate in the Pikes Peak region. You can look back at our 2025 PeopleForBikes City Ratings Article to see how the discussion has evolved since last year.
📌 A Note on the Data Timeline: It is important to know that PeopleForBikes pulled and analyzed this data back in March. Because of that snapshot timeline, these scores do not include any of the safety projects planned and scheduled to be built on the ground later this year.
Raising the Bar: Paint is Not Protection
In the past, conventional painted bike lanes on busy streets (up to 30 mph) were often counted as “low-stress” simply because space was allocated to bikes. The 2026 update changes that by aligning with the newest national design standards from the National Association of City Transportation Officials (NACTO).
The Big Change: For a painted or buffered bike lane to be considered low-stress, the street must have a much lower speed limit (25 mph) than previously allowed. Since the vast majority of our on-street lanes in Colorado Springs are striped onto faster, multi-lane roads, very few of them survived the cut. Under the new rules, they are correctly labeled in the two-tier rating structure as high-stress vs. low-stress.
A few other strict rules were added that directly impact us:
- No long detours: If a low-stress route forces you to take a detour that is more than 25% longer than a direct path, it gets tossed out. Riders need direct options, not just scenic workarounds.
- Strict city boundaries: The analysis now looks strictly inside city borders, removing lines outside a city’s direct control.
Because of these changes, comparisons between 2025 and 2026 aren’t apples-to-apples. A flat score doesn’t mean we lost physical infrastructure; it means the data has finally caught up to the reality of the rider experience.
Colorado State
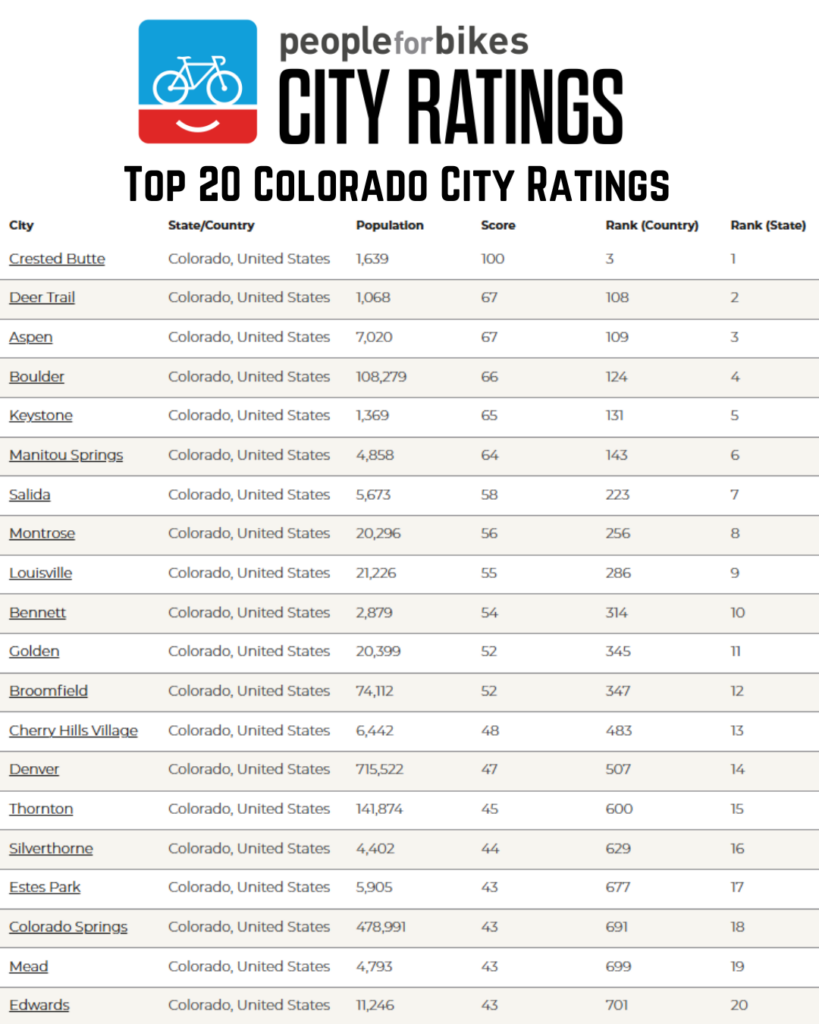
Top 20 Ratings
In looking at the top 20 Colorado Cities it’s clear that it’s easier for smaller cities to rank higher, and it’s interesting that a Platnium League of American Bicyclists Bicycle Friendly city like Fort Collins (23) is rated below Colorado Springs (18)
Colorado Springs: A Clear Map of Our Connectivity Gaps
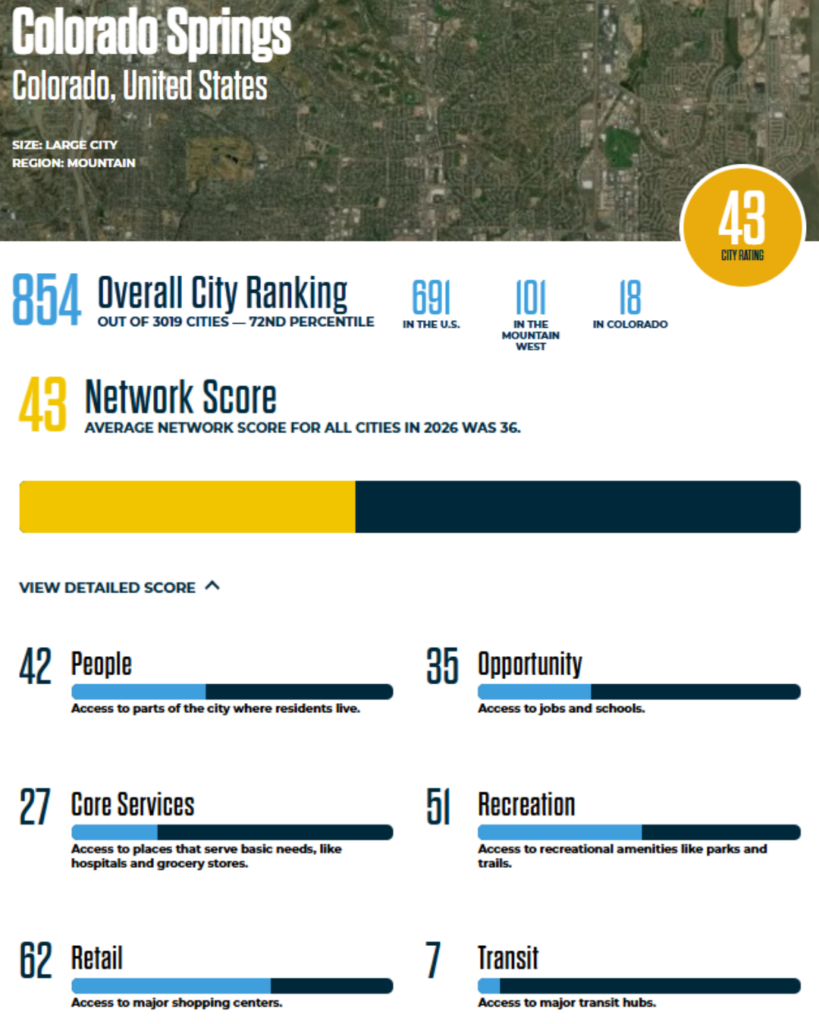
Overall Network Score: 43/100
(National Average: 36)
Colorado Springs earned a 43 out of 100, landing just above the national average. While our incredible urban trail system—like the Legacy Loop, Pikes Peak Greenway, and Sand Creek Trail—continues to shine (giving us a solid Recreation score of 51), our everyday street network has some catching up to do.
- Explore the PeopleForBikes Colorado Springs City Rating.
- Dive into the deep data with the PeopleForBikes Colorado Springs Bike Network Analysis.
The detailed breakdown from the image below shows exactly what it feels like to ride here:
- People (42/100): How easily neighbors can ride through residential neighborhoods.
- Retail (62/100): Our highest score, meaning good proximity to major shopping areas.
- Opportunity (35/100) & Core Services (27/100): Gaps in safely reaching jobs, schools, hospitals, and grocery stores.
- Transit (7/100): A deep disconnect in how our bike lanes link up with major transit options.
COS City Rating Categories 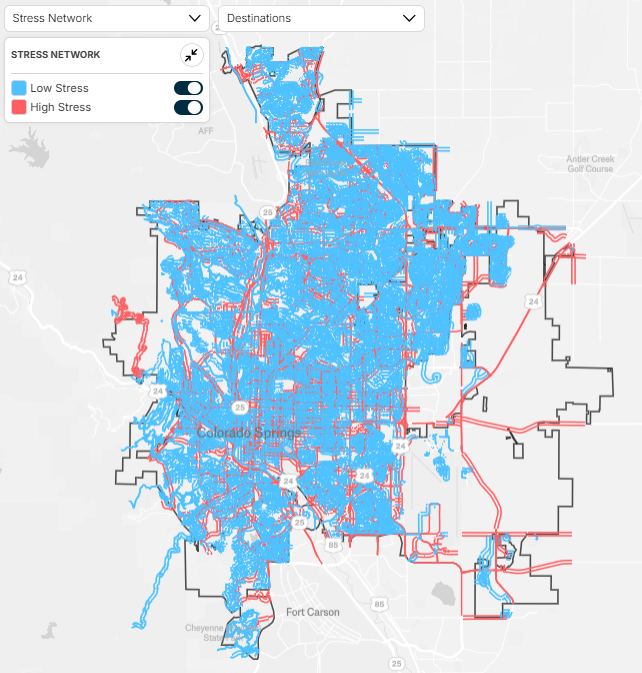
COS Bike Network analysis High & Low Stress 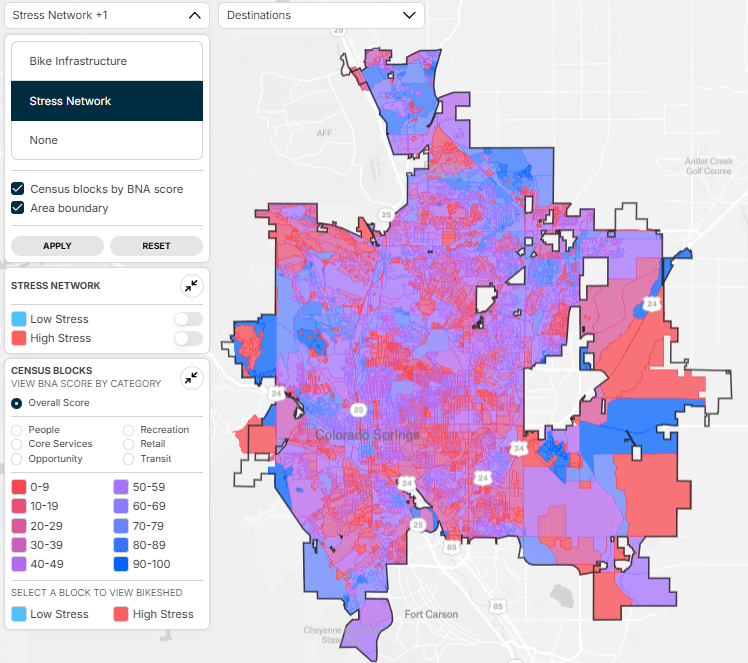
COS Census Block BNA Score

The Blind Spot of Borders
While drawing strict lines makes things easy for data analysts, it creates a massive blind spot for local riders. Colorado Springs is full of unincorporated county “enclaves”, (Ex. Cimaron Hills just east of Powers Blvd) neighborhoods completely surrounded by the city that technically sit under El Paso County jurisdiction.
When you ride from your house to the grocery store, you don’t feel a boundary line; you just experience an infrastructure gap. Because these areas fall outside city limits, they disappear from the city’s official score. Bike Colorado Springs will continue to lean on local knowledge to make sure county-level gaps are part of the advocacy story we tell.
This updated baseline highlights why initiatives like Safe Streets COS (aiming to cut serious crashes by 35% by 2035) and the Colorado Avenue Demonstration Project are so vital. Reconfiguring roads to add physical protection is the only path toward lifting our score.
Manitou Springs: Great Footprint, Regional Challenges
Overall Network Score: 64/100
(National Average: 36)
Manitou Springs continues to score remarkably high at 64 out of 100, thanks to its compact, walkable footprint.
- Explore the PeopleForBikes Manitou Springs City Rating.
- Dive into the deep data with the PeopleForBikes Manitou Springs Bike Network Analysis.
The category breakdowns from the image below show strong numbers across the board:
- People (70/100): Excellent neighborhood connections.
- Retail (75/100) & Recreation (74/100): Exceptional access to shopping and iconic outdoor spaces.
- Opportunity (55/100) & Transit (48/100): Solid baselines for getting to schools, work, and buses.
- Core Services (N/A): This is marked as Not Applicable because essential daily destinations, like the nearest major hospital or full-service grocery store, sit over a mile outside Manitou’s strict city borders.
Manitou’s geography creates natural barriers. The new rule filtering out long detours reminds us that even when a community is highly rideable internally, getting safely across city lines to reach necessary regional services remains a major hurdle for a Manitou neighbor. True connectivity requires regional teamwork.
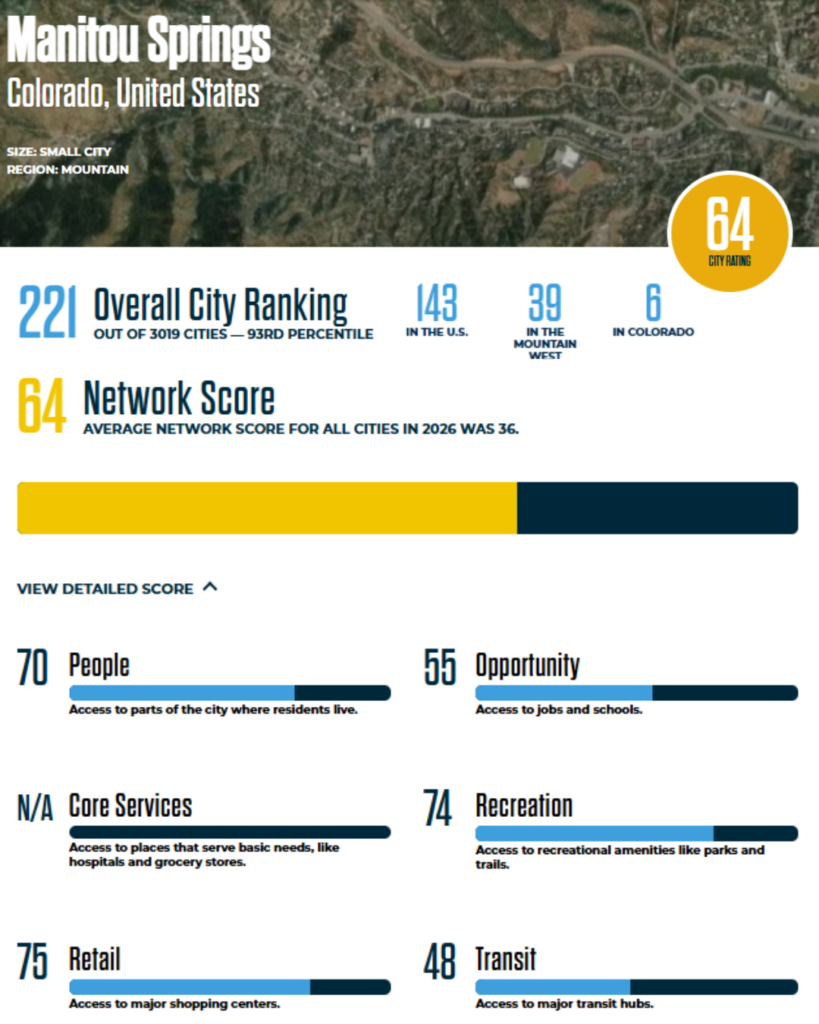
Manitou City Rating Categories 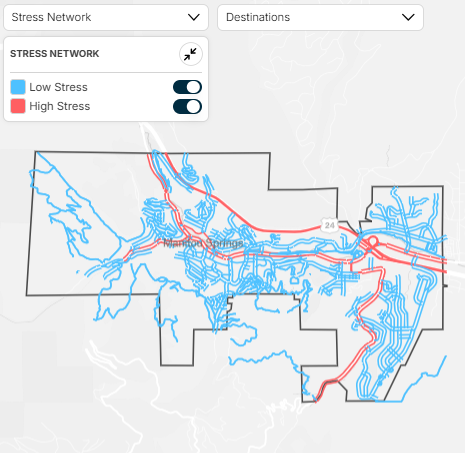
Manitou Bike Network analysis High & Low Stress 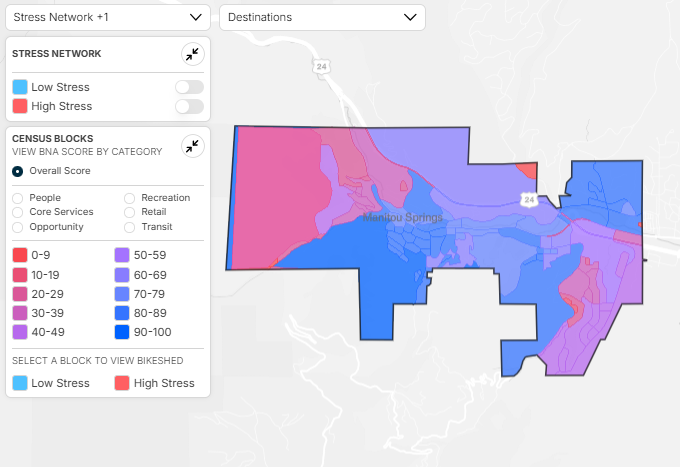
COS Census Block BNA Score
The Takeaway: Leveraging Local Data to Close the Gaps
The 2026 PeopleForBikes ratings aren’t a setback. They give us an incredibly accurate map of where our network is serving neighbors and where it is falling short.
Interestingly, both PeopleForBikes and our local Bike Streets platform use the exact same OpenStreetMap (OSM) data, but they look at it through different lenses. While the national BNA exposes the harsh reality of our high-stress arterials, Bike Streets uses that same map data to find a creative way forward. It deliberately stitches together the quiet, hidden, and low-stress neighborhood paths we do have to help riders safely avoid those high-stress corridors right now. The more we can accurately map our bike and trail network in OpenStreetMap, the more accurate our national BNA score will be, and the more useful neighborhood routing through Bike Streets becomes.
We know that lowering speed limits on local roads is a tough political lift, and building physically protected lanes takes funding that our under-resourced city teams struggle to secure. But by raising the standard, PeopleForBikes has validated what local riders feel every day: speed and physical separation determine whether a bike lane is actually useful.
We Need Your Help!
Want to make sure our city gets the credit it deserves and that our neighborhood routes stay reliable? We are looking for map-loving volunteers to help update our local network! Take five minutes to review your regular riding routes, check out our Bike Colorado Springs Mapping Resource Page, and help us keep the data accurate. Whether you want to edit OSM on your own or join us for a group map-learning session, your local knowledge is the secret weapon to building a better, safer, low-stress network for everyone.
And if mapping isn’t your thing, we have opportunities for all types of advocates! Check out our main Volunteer Page for current opportunities and reach out if there’s another way you’d like to lend a hand.


